My old friend
I live in Berkeley, California, which is known for at least three things:
- Bike theft
- Vegetarian food
- Liberalism
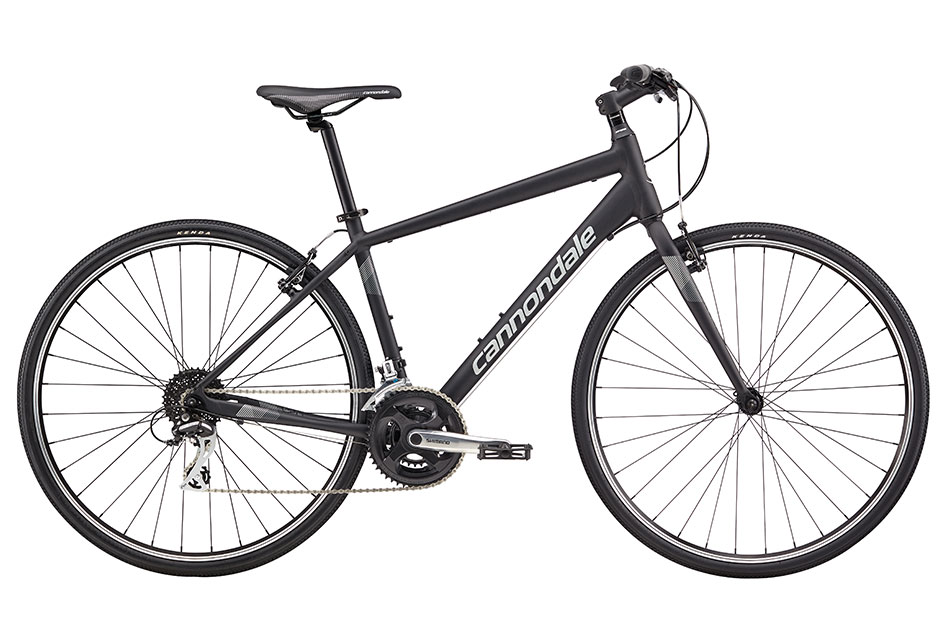
I'll tackle the first of these topics today; the other two deserve (several) longer posts. When I moved out to Berkeley, I bought a trusty Cannondale Quick 7 bike from the good people at Huckleberry Bikes.
Six weeks later I was bike-less after having made a rookie mistake locking my bike [1]. It was sad. I may or may not have gone back to the location where I locked my bike multiple times just hoping that it would magically return. Needless to say, it didn't.
I immediately reported the theft to the Berkeley police and a wonderful nonprofit, the Bike Index, which is exactly what it sounds like—they track new and used bikes. When you buy a bike, you register it on their master list of bikes, and if your bike is stolen, you also report that. I'm told that legitimate bike shops in the Bay Area will check with the Bike Index before selling a used bike.
When I reported that my beloved Quick 7 was stolen, I found a small source of consolation: the Bike Index makes their data publicly available and they've got tons of it. They have data on hundreds of thousands of bikes that have been bought, registered, and (unfortunately) stolen since the mid 2000s, and it's all conveniently packaged and available through their API. I set out to understand: how common was my situation, and, aside from locking my bike better, is there anything I could have done differently?
What I found (code)
Using the Python url, json, and csv libraries, I downloaded all of the Bay Area bike theft data from the Bike Index since late 2010. I took a look at the aggregate number of monthly bike thefts:
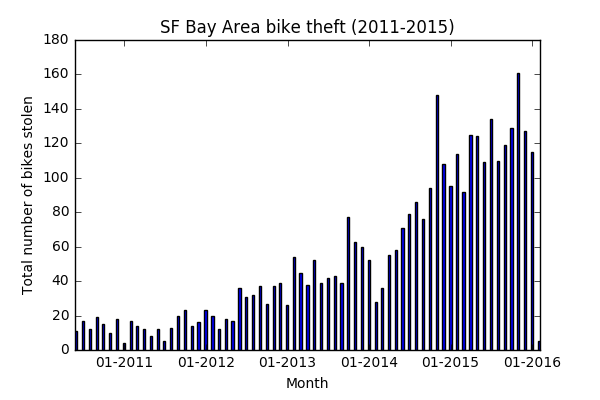
At first I thought, "Wow there's been this huge increase!" I did a bit of poking around, though, and discovered that the Bike Index really only took off in 2014—they started tracking bike theft in 2004 but then really moved things up a notch and rebranded with a Kickstarter campaign they held 2013. So what's probably revealed here is more increased usage of the service rather than a genuine increase in bike theft in the Bay Area.
I then had the idea to normalize the data, though. In other words, I asked: out of the total bikes stolen every year, what portion are stolen in each month? Here's what came out:
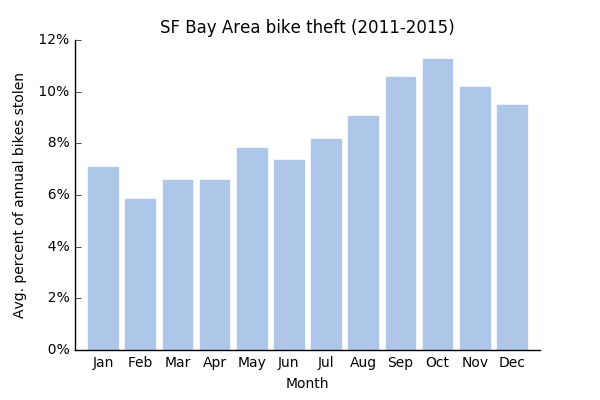
There's a definite increase during the fall, and just my luck, my bike theft month—October—was the most frequent one. So I guess if I were to tell you anything, it would be to guard your bike during October. Only half kidding.
Discussion
I did have to wonder, why do we see this huge uptick? It seems unlikely that suddenly the bike you (individually) own is more susceptible to theft in September and October. Here are a couple of ideas I had:
- There are more bikes on the road in the fall: This is possible. I'm sure, like me, there are many folks living on the September to September rent cycle who move to the Bay Area in the fall and buy bikes around then. You have to wonder, though, what happens to those people in the winter/spring? Do they stop riding their bikes? Remember, this isn't New England—people aren't hibernating from December--May.
- There are more new bikes on the road in the fall: Now this is very possible, especially if you believe the September-September rent cycle premise. Case in point: yours truly [2]. Those bikes may be more attractive to bike thieves because they are easier to sell on the secondary market when they are fresh off the rack from a bike shop (vs. a few months old).
- Bike Index adoption effects: Assuming that the number of Bike Index users steadily increased from 2011-2015, you would expect that there were more people using the service in, say, November of a given year than in January of that same year. So normalizing the theft data would still not fully correct for the adoption effects that confounded the first month-by-month view. I don't think that this is the explanation, though—at least not most of it. First, if you just eyeball the non-normalized data, there's definitely a real increase from 2011 to 2016, but that trend is much less clear within a given year. Second, and more compellingly, there's a subtle but very real drop off from October as we head into November and December, supporting the view that there's some seasonality at play—thefts peak in the fall and then drop back down as we go into the winter.
Other ideas? Feel free to shoot me a note! I have since acquired another bike—this one used and even more nondescript than my blessed Cannondale—but I'm still scratching my head on this one.
1. It involved locking my bike to a five-foot-tall pole that was exposed to the open air—nothing keeping anyone from lifting the whole bike, lock and all, off and riding away. I now realize that that was not a good idea.
2. I've noticed that, in the Bay Area, there's a premium placed on being native to the area. So many people are transplants, whether they came out here for school or to make it as entrepreneurs. There's this odd outsider feeling you get, especially when surrounded by true Bay Area natives, that hasn't quite gone away. I expect that it will at some point.